Introduction_to_Dairy_LCA_cowfootR
Source:vignettes/Introduction_to_Dairy_LCA_cowfootR.Rmd
Introduction_to_Dairy_LCA_cowfootR.RmdIntroduction to Dairy Life Cycle Assessment
Overview
The dairy industry plays a crucial role in global food security, but it also contributes significantly to greenhouse gas emissions. Understanding and quantifying the environmental impact of dairy production is essential for sustainable development and climate change mitigation.
The cowfootR package provides a comprehensive toolkit for calculating dairy farm carbon footprints following internationally recognized standards, specifically the International Dairy Federation (IDF) 2022 guidelines and IPCC 2019 methodologies.
Theoretical Background
Life Cycle Assessment in Dairy Production
Life Cycle Assessment (LCA) is a systematic approach to evaluating the environmental impacts of a product or service throughout its entire life cycle. In dairy production, LCA helps quantify greenhouse gas emissions from various sources within the farm system.
Key Emission Sources in Dairy Systems
Dairy farm emissions primarily originate from five main sources:
- Enteric Fermentation: Methane (CH₄) produced during digestion in ruminants
- Manure Management: CH₄ and nitrous oxide (N₂O) from manure storage and treatment
- Soil Emissions: N₂O from nitrogen fertilizers and excreta deposition
- Energy Use: Carbon dioxide (CO₂) from fossil fuel combustion and electricity
- Purchased Inputs: Embodied emissions in feeds, fertilizers, and materials
Getting Started with cowfootR
Installation
# Install from CRAN (when available)
install.packages("cowfootR")

# Or install development version from GitHub
# devtools::install_github("yourusername/cowfootR")Example: Basic Farm Assessment
Step 1: Define System Boundaries
# Define farm-gate boundaries (most common approach)
boundaries <- set_system_boundaries("farm_gate")
print(boundaries)
#> $scope
#> [1] "farm_gate"
#>
#> $include
#> [1] "enteric" "manure"  "soil"    "energy"  "inputs"
Step 2: Basic Farm Data
For this example, we’ll use data from a typical dairy farm:
# Farm characteristics
farm_data <- list(
  # Herd composition
  dairy_cows = 100,
  heifers = 30,
  calves = 25,

  # Production
  milk_litres = 600000,  # Annual milk production
  milk_yield_per_cow = 6000,  # kg/cow/year

  # Farm area
  total_area_ha = 120,
  productive_area_ha = 110,

  # Inputs
  concentrate_kg = 180000,  # Annual concentrate use
  n_fertilizer_kg = 1500,   # Nitrogen fertilizer
  diesel_litres = 8000,     # Annual diesel consumption
  electricity_kwh = 35000   # Annual electricity use
)

print(farm_data)
#> $dairy_cows
#> [1] 100
#>
#> $heifers
#> [1] 30
#>
#> $calves
#> [1] 25
#>
#> $milk_litres
#> [1] 6e+05
#>
#> $milk_yield_per_cow
#> [1] 6000
#>
#> $total_area_ha
#> [1] 120
#>
#> $productive_area_ha
#> [1] 110
#>
#> $concentrate_kg
#> [1] 180000
#>
#> $n_fertilizer_kg
#> [1] 1500
#>
#> $diesel_litres
#> [1] 8000
#>
#> $electricity_kwh
#> [1] 35000
Step 3: Calculate Emissions by Source
Now we calculate emissions from each source using the individual calculation functions:
Enteric Fermentation
# Calculate enteric methane emissions
enteric_emissions <- calc_emissions_enteric(
  n_animals = farm_data$dairy_cows,
  cattle_category = "dairy_cows",
  avg_milk_yield = farm_data$milk_yield_per_cow,
  tier = 2,  # Use Tier 2 for more accurate results
  boundaries = boundaries
)

print(enteric_emissions)
#> $source
#> [1] "enteric"
#>
#> $category
#> [1] "dairy_cows"
#>
#> $production_system
#> [1] "mixed"
#>
#> $ch4_kg
#> [1] 9429.19
#>
#> $co2eq_kg
#> [1] 256474
#>
#> $emission_factors
#> $emission_factors$emission_factor_ch4
#> [1] 94.292
#>
#> $emission_factors$ym_percent
#> [1] 6.5
#>
#> $emission_factors$gwp_ch4
#> [1] 27.2
#>
#> $emission_factors$method_used
#> [1] "Tier 2"
#>
#>
#> $inputs
#> $inputs$n_animals
#> [1] 100
#>
#> $inputs$avg_body_weight
#> [1] 550
#>
#> $inputs$avg_milk_yield
#> [1] 6000
#>
#> $inputs$dry_matter_intake
#> NULL
#>
#> $inputs$feed_inputs
#> NULL
#>
#> $inputs$tier
#> [1] 2
#>
#>
#> $methodology
#> [1] "IPCC Tier 2 (GE-based where possible)"
#>
#> $standards
#> [1] "IPCC 2019 Refinement, IDF 2022"
#>
#> $date
#> [1] "2025-10-16"
#>
#> $per_animal
#> $per_animal$ch4_kg
#> [1] 94.292
#>
#> $per_animal$co2eq_kg
#> [1] 2564.741
#>
#> $per_animal$milk_intensity_kg_co2eq_per_kg_milk
#> [1] 0.4275
Manure Management
# Calculate manure management emissions
manure_emissions <- calc_emissions_manure(
  n_cows = farm_data$dairy_cows,
  manure_system = "pasture",  # Typical for extensive systems
  tier = 2,
  include_indirect = TRUE,
  boundaries = boundaries
)

print(manure_emissions)
#> $source
#> [1] "manure"
#>
#> $system
#> [1] "pasture"
#>
#> $tier
#> [1] 2
#>
#> $climate
#> [1] "temperate"
#>
#> $ch4_kg
#> [1] 2139.32
#>
#> $n2o_direct_kg
#> [1] 314.29
#>
#> $n2o_indirect_kg
#> [1] 57.75
#>
#> $n2o_total_kg
#> [1] 372.04
#>
#> $co2eq_kg
#> [1] 159755.4
#>
#> $emission_factors
#> $emission_factors$ef_ch4
#> [1] NA
#>
#> $emission_factors$ef_n2o_direct
#> [1] 0.02
#>
#> $emission_factors$gwp_ch4
#> [1] 27.2
#>
#> $emission_factors$gwp_n2o
#> [1] 273
#>
#>
#> $inputs
#> $inputs$n_cows
#> [1] 100
#>
#> $inputs$n_excreted
#> [1] 100
#>
#> $inputs$manure_system
#> [1] "pasture"
#>
#> $inputs$include_indirect
#> [1] TRUE
#>
#> $inputs$avg_body_weight
#> [1] 600
#>
#> $inputs$diet_digestibility
#> [1] 0.65
#>
#>
#> $methodology
#> [1] "IPCC Tier 2 (VS_B0_MCF calculation)"
#>
#> $standards
#> [1] "IPCC 2019 Refinement, IDF 2022"
#>
#> $date
#> [1] "2025-10-16"
#>
#> $per_cow
#> $per_cow$ch4_kg
#> [1] 21.3932
#>
#> $per_cow$n2o_kg
#> [1] 3.720357
#>
#> $per_cow$co2eq_kg
#> [1] 1597.553
#>
#>
#> $tier2_details
#> $tier2_details$vs_kg_per_day
#> [1] 32.4
#>
#> $tier2_details$b0_used
#> [1] 0.18
#>
#> $tier2_details$mcf_used
#> [1] 1.5
Soil Emissions
# Calculate soil N2O emissions
soil_emissions <- calc_emissions_soil(
  n_fertilizer_synthetic = farm_data$n_fertilizer_kg,
  n_excreta_pasture = farm_data$dairy_cows * 100,  # Estimated N excretion
  area_ha = farm_data$total_area_ha,
  soil_type = "well_drained",
  climate = "temperate",
  include_indirect = TRUE,
  boundaries = boundaries
)

print(soil_emissions)
#> $source
#> [1] "soil"
#>
#> $soil_conditions
#> $soil_conditions$soil_type
#> [1] "well_drained"
#>
#> $soil_conditions$climate
#> [1] "temperate"
#>
#>
#> $nitrogen_inputs
#> $nitrogen_inputs$synthetic_fertilizer_kg_n
#> [1] 1500
#>
#> $nitrogen_inputs$organic_fertilizer_kg_n
#> [1] 0
#>
#> $nitrogen_inputs$excreta_pasture_kg_n
#> [1] 10000
#>
#> $nitrogen_inputs$crop_residues_kg_n
#> [1] 0
#>
#> $nitrogen_inputs$total_kg_n
#> [1] 11500
#>
#>
#> $emissions_breakdown
#> $emissions_breakdown$direct_n2o_kg
#> [1] 180.714
#>
#> $emissions_breakdown$indirect_volatilization_n2o_kg
#> [1] 33.786
#>
#> $emissions_breakdown$indirect_leaching_n2o_kg
#> [1] 40.661
#>
#> $emissions_breakdown$total_indirect_n2o_kg
#> [1] 74.446
#>
#> $emissions_breakdown$total_n2o_kg
#> [1] 255.161
#>
#>
#> $co2eq_kg
#> [1] 69658.88
#>
#> $emission_factors
#> $emission_factors$ef_direct
#> [1] 0.01
#>
#> $emission_factors$ef_volatilization
#> [1] 0.01
#>
#> $emission_factors$ef_leaching
#> [1] 0.0075
#>
#> $emission_factors$gwp_n2o
#> [1] 273
#>
#> $emission_factors$factors_source
#> [1] "IPCC-style defaults (temperate, well_drained)"
#>
#>
#> $methodology
#> [1] "Tier 1-style (direct + indirect)"
#>
#> $standards
#> [1] "IPCC 2019 Refinement, IDF 2022"
#>
#> $date
#> [1] "2025-10-16"
#>
#> $per_hectare_metrics
#> $per_hectare_metrics$n_input_kg_per_ha
#> [1] 95.8
#>
#> $per_hectare_metrics$n2o_kg_per_ha
#> [1] 2.126
#>
#> $per_hectare_metrics$co2eq_kg_per_ha
#> [1] 580.49
#>
#> $per_hectare_metrics$emission_intensity_kg_co2eq_per_kg_n
#> [1] 6.06
#>
#>
#> $source_contributions
#> $source_contributions$synthetic_fertilizer_pct
#> [1] 13
#>
#> $source_contributions$organic_fertilizer_pct
#> [1] 0
#>
#> $source_contributions$excreta_pasture_pct
#> [1] 87
#>
#> $source_contributions$crop_residues_pct
#> [1] 0
#>
#> $source_contributions$direct_emissions_pct
#> [1] 70.8
#>
#> $source_contributions$indirect_emissions_pct
#> [1] 29.2
Energy Use
# Calculate energy-related emissions
energy_emissions <- calc_emissions_energy(
  diesel_l = farm_data$diesel_litres,
  electricity_kwh = farm_data$electricity_kwh,
  country = "UY",  # Uruguay electricity grid
  boundaries = boundaries
)

print(energy_emissions)
#> $source
#> [1] "energy"
#>
#> $fuel_emissions
#> $fuel_emissions$diesel_co2_kg
#> [1] 21360
#>
#> $fuel_emissions$petrol_co2_kg
#> [1] 0
#>
#> $fuel_emissions$lpg_co2_kg
#> [1] 0
#>
#> $fuel_emissions$natural_gas_co2_kg
#> [1] 0
#>
#> $fuel_emissions$electricity_co2_kg
#> [1] 2800
#>
#>
#> $direct_co2eq_kg
#> [1] 24160
#>
#> $upstream_co2eq_kg
#> [1] 0
#>
#> $co2eq_kg
#> [1] 24160
#>
#> $emission_factors
#> $emission_factors$diesel_kg_co2_per_l
#> [1] 2.67
#>
#> $emission_factors$petrol_kg_co2_per_l
#> [1] 2.31
#>
#> $emission_factors$lpg_kg_co2_per_kg
#> [1] 3
#>
#> $emission_factors$natural_gas_kg_co2_per_m3
#> [1] 2
#>
#> $emission_factors$electricity_kg_co2_per_kwh
#> [1] 0.08
#>
#> $emission_factors$electricity_country
#> [1] "UY"
#>
#>
#> $inputs
#> $inputs$diesel_l
#> [1] 8000
#>
#> $inputs$petrol_l
#> [1] 0
#>
#> $inputs$lpg_kg
#> [1] 0
#>
#> $inputs$natural_gas_m3
#> [1] 0
#>
#> $inputs$electricity_kwh
#> [1] 35000
#>
#> $inputs$include_upstream
#> [1] FALSE
#>
#>
#> $methodology
#> [1] "IPCC 2019 emission factors"
#>
#> $standards
#> [1] "IPCC 2019 Refinement, IDF 2022"
#>
#> $date
#> [1] "2025-10-16"
#>
#> $energy_metrics
#> $energy_metrics$electricity_share_pct
#> [1] 11.6
#>
#> $energy_metrics$fossil_fuel_share_pct
#> [1] 88.4
#>
#> $energy_metrics$co2_intensity_kg_per_mwh
#> [1] 80
Purchased Inputs
# Calculate emissions from purchased inputs
input_emissions <- calc_emissions_inputs(
  conc_kg = farm_data$concentrate_kg,
  fert_n_kg = farm_data$n_fertilizer_kg,
  region = "global",  # Use global emission factors
  boundaries = boundaries
)

print(input_emissions)
#> $source
#> [1] "inputs"
#>
#> $emissions_breakdown
#> $emissions_breakdown$concentrate_co2eq_kg
#> [1] 126000
#>
#> $emissions_breakdown$fertilizer_co2eq_kg
#> [1] 9900
#>
#> $emissions_breakdown$plastic_co2eq_kg
#> [1] 0
#>
#> $emissions_breakdown$feeds_co2eq_kg
#>  grain_dry  grain_wet     ration byproducts   proteins       corn        soy
#>          0          0          0          0          0          0          0
#>      wheat
#>          0
#>
#> $emissions_breakdown$total_feeds_co2eq_kg
#> [1] 0
#>
#> $emissions_breakdown$transport_adjustment_co2eq_kg
#> [1] 0
#>
#>
#> $co2eq_kg
#> [1] 135900
#>
#> $total_co2eq_kg
#> [1] 135900
#>
#> $region
#> [1] "global"
#>
#> $emission_factors_used
#> $emission_factors_used$concentrate
#> $emission_factors_used$concentrate$value
#> [1] 0.7
#>
#> $emission_factors_used$concentrate$unit
#> [1] "kg CO2e/kg"
#>
#>
#> $emission_factors_used$fertilizer
#> $emission_factors_used$fertilizer$value
#> [1] 6.6
#>
#> $emission_factors_used$fertilizer$type
#> [1] "mixed"
#>
#> $emission_factors_used$fertilizer$unit
#> [1] "kg CO2e/kg N"
#>
#>
#> $emission_factors_used$plastic
#> $emission_factors_used$plastic$value
#> [1] 2.5
#>
#> $emission_factors_used$plastic$type
#> [1] "mixed"
#>
#> $emission_factors_used$plastic$unit
#> [1] "kg CO2e/kg"
#>
#>
#> $emission_factors_used$feeds
#> $emission_factors_used$feeds$grain_dry
#> $emission_factors_used$feeds$grain_dry$value
#> [1] 0.4
#>
#> $emission_factors_used$feeds$grain_dry$unit
#> [1] "kg CO2e/kg"
#>
#>
#> $emission_factors_used$feeds$grain_wet
#> $emission_factors_used$feeds$grain_wet$value
#> [1] 0.3
#>
#> $emission_factors_used$feeds$grain_wet$unit
#> [1] "kg CO2e/kg"
#>
#>
#> $emission_factors_used$feeds$ration
#> $emission_factors_used$feeds$ration$value
#> [1] 0.6
#>
#> $emission_factors_used$feeds$ration$unit
#> [1] "kg CO2e/kg"
#>
#>
#> $emission_factors_used$feeds$byproducts
#> $emission_factors_used$feeds$byproducts$value
#> [1] 0.15
#>
#> $emission_factors_used$feeds$byproducts$unit
#> [1] "kg CO2e/kg"
#>
#>
#> $emission_factors_used$feeds$proteins
#> $emission_factors_used$feeds$proteins$value
#> [1] 1.8
#>
#> $emission_factors_used$feeds$proteins$unit
#> [1] "kg CO2e/kg"
#>
#>
#> $emission_factors_used$feeds$corn
#> $emission_factors_used$feeds$corn$value
#> [1] 0.45
#>
#> $emission_factors_used$feeds$corn$unit
#> [1] "kg CO2e/kg"
#>
#>
#> $emission_factors_used$feeds$soy
#> $emission_factors_used$feeds$soy$value
#> [1] 2.1
#>
#> $emission_factors_used$feeds$soy$unit
#> [1] "kg CO2e/kg"
#>
#>
#> $emission_factors_used$feeds$wheat
#> $emission_factors_used$feeds$wheat$value
#> [1] 0.52
#>
#> $emission_factors_used$feeds$wheat$unit
#> [1] "kg CO2e/kg"
#>
#>
#>
#> $emission_factors_used$region_source
#> [1] "global"
#>
#> $emission_factors_used$transport_km
#> [1] 0
#>
#>
#> $inputs_summary
#> $inputs_summary$concentrate_kg
#> [1] 180000
#>
#> $inputs_summary$fertilizer_n_kg
#> [1] 1500
#>
#> $inputs_summary$plastic_kg
#> [1] 0
#>
#> $inputs_summary$total_feeds_kg
#> [1] 0
#>
#> $inputs_summary$feed_breakdown_kg
#> $inputs_summary$feed_breakdown_kg$grain_dry
#> [1] 0
#>
#> $inputs_summary$feed_breakdown_kg$grain_wet
#> [1] 0
#>
#> $inputs_summary$feed_breakdown_kg$ration
#> [1] 0
#>
#> $inputs_summary$feed_breakdown_kg$byproducts
#> [1] 0
#>
#> $inputs_summary$feed_breakdown_kg$proteins
#> [1] 0
#>
#> $inputs_summary$feed_breakdown_kg$corn
#> [1] 0
#>
#> $inputs_summary$feed_breakdown_kg$soy
#> [1] 0
#>
#> $inputs_summary$feed_breakdown_kg$wheat
#> [1] 0
#>
#>
#>
#> $contribution_analysis
#> $contribution_analysis$concentrate_pct
#> [1] 92.7
#>
#> $contribution_analysis$fertilizer_pct
#> [1] 7.3
#>
#> $contribution_analysis$plastic_pct
#> [1] 0
#>
#> $contribution_analysis$feeds_pct
#> [1] 0
#>
#> $contribution_analysis$transport_pct
#> [1] 0
#>
#>
#> $uncertainty
#> NULL
#>
#> $methodology
#> [1] "Regional emission factors with optional uncertainty analysis"
#>
#> $standards
#> [1] "IDF 2022; generic LCI sources"
#>
#> $date
#> [1] "2025-10-16"
Step 4: Aggregate Total Emissions
# Combine all emission sources
total_emissions <- calc_total_emissions(
  enteric_emissions,
  manure_emissions,
  soil_emissions,
  energy_emissions,
  input_emissions
)

total_emissions
#> Carbon Footprint - Total Emissions
#> ==================================
#> Total CO2eq: 645948.3 kg
#> Number of sources: 5
#>
#> Breakdown by source:
#>   energy : 24160 kg CO2eq
#>   enteric : 256474 kg CO2eq
#>   inputs : 135900 kg CO2eq
#>   manure : 159755.4 kg CO2eq
#>   soil : 69658.88 kg CO2eq
#>
#> Calculated on: 2025-10-16
Step 5: Calculate Intensity Metrics
Milk Intensity
# Calculate emissions per kg of milk (FPCM)
milk_intensity <- calc_intensity_litre(
  total_emissions = total_emissions,
  milk_litres = farm_data$milk_litres,
  fat = 3.8,      # Typical fat content
  protein = 3.2   # Typical protein content
)

print(milk_intensity)
#> Carbon Footprint Intensity
#> ==========================
#> Intensity: 1.08 kg CO2eq/kg FPCM
#>
#> Production data:
#>  Raw milk (L): 6e+05 L
#>  Raw milk (kg): 618,000 kg
#>  FPCM (kg): 597,977 kg
#>  Fat content: 3.8 %
#>  Protein content: 3.2 %
#>
#> Total emissions: 645,948 kg CO2eq
#> Calculated on: 2025-10-16
Area Intensity
# Calculate emissions per hectare
area_intensity <- calc_intensity_area(
  total_emissions = total_emissions,
  area_total_ha = farm_data$total_area_ha,
  area_productive_ha = farm_data$productive_area_ha,
  area_breakdown = list(
    pasture_permanent = 80,
    pasture_temporary = 20,
    crops_feed = 15,
    infrastructure = 5
  )
)

print(area_intensity)
#> Carbon Footprint Area Intensity
#> ===============================
#> Intensity (total area): 5382.9 kg CO2eq/ha
#> Intensity (productive area): 5872.26 kg CO2eq/ha
#>
#> Area summary:
#>  Total area: 120 ha
#>  Productive area: 110 ha
#>  Land use efficiency: 91.7%
#>
#> Land use breakdown:
#>  pasture permanent: 80.0 ha (66.7%) -> 430632 kg CO2eq
#>  pasture temporary: 20.0 ha (16.7%) -> 107658 kg CO2eq
#>  crops feed: 15.0 ha (12.5%) -> 80744 kg CO2eq
#>  infrastructure: 5.0 ha (4.2%) -> 26914 kg CO2eq
#>
#> Total emissions: 645,948 kg CO2eq
#> Calculated on: 2025-10-16
Visualizing Results
Emission Source Breakdown
# Create a data frame for plotting
emission_breakdown <- data.frame(
  Source = names(total_emissions$breakdown),
  Emissions = as.numeric(total_emissions$breakdown)
)

# Create pie chart
ggplot(emission_breakdown, aes(x = "", y = Emissions, fill = Source)) +
  geom_col(width = 1) +
  coord_polar("y", start = 0) +
  theme_void() +
  labs(title = "Farm Emissions by Source",
       subtitle = paste("Total:", round(total_emissions$total_co2eq), "kg CO₂eq/year")) +
  theme(plot.title = element_text(hjust = 0.5),
        plot.subtitle = element_text(hjust = 0.5))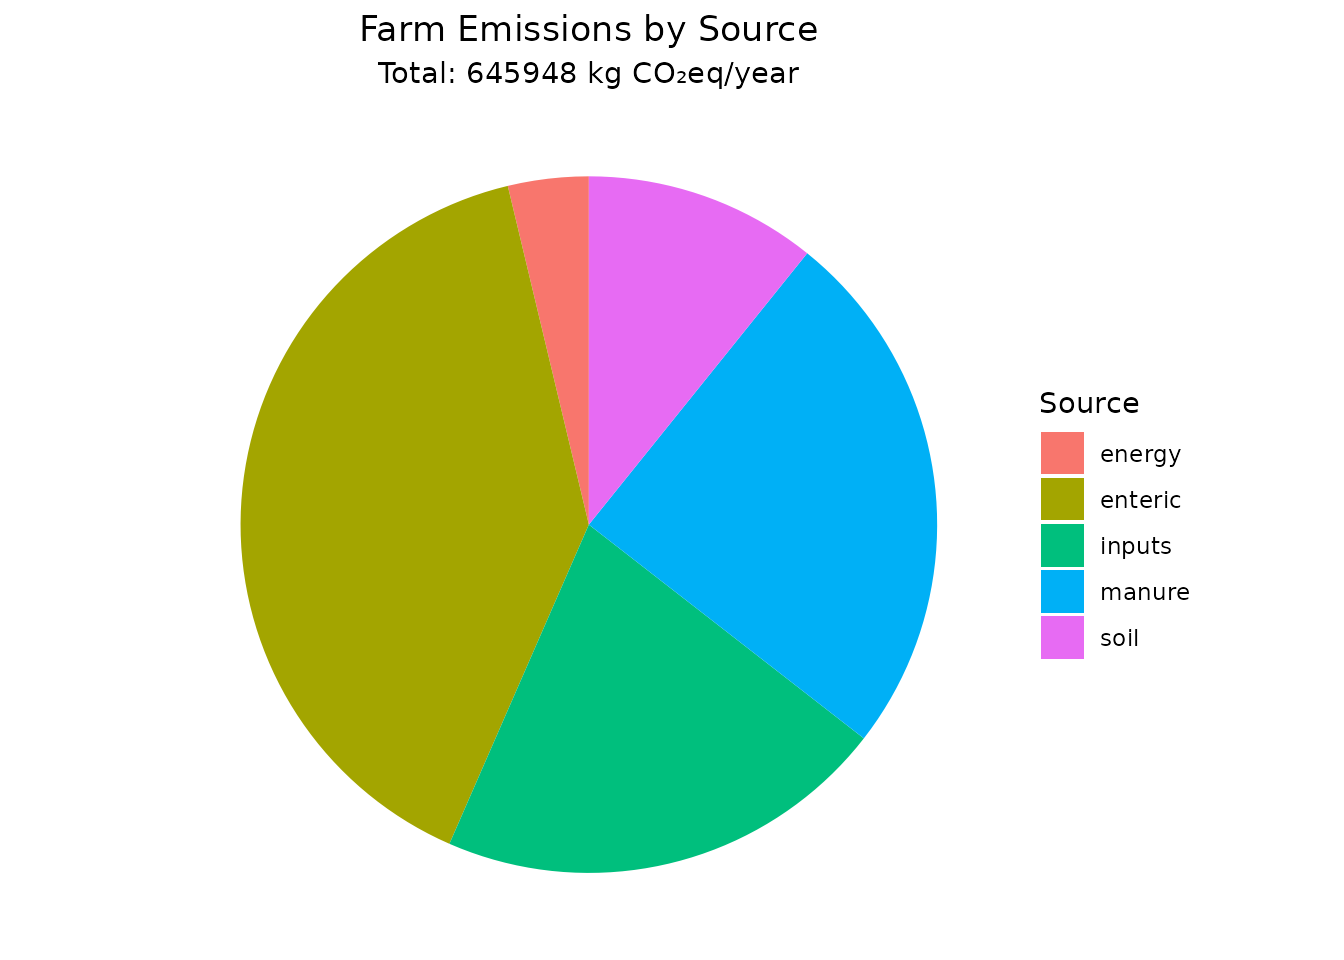
Intensity Comparison
# Create comparison chart
intensity_data <- data.frame(
  Metric = c("Milk Intensity\n(kg CO₂eq/kg FPCM)",
             "Area Intensity\n(kg CO₂eq/ha)"),
  Value = c(milk_intensity$intensity_co2eq_per_kg_fpcm,
            area_intensity$intensity_per_productive_ha),
  Benchmark = c(1.2, 8000)  # Typical benchmark values
)

ggplot(intensity_data, aes(x = Metric)) +
  geom_col(aes(y = Value), fill = "steelblue", alpha = 0.7) +
  geom_point(aes(y = Benchmark), color = "red", size = 3) +
  geom_text(aes(y = Benchmark, label = "Benchmark"),
            color = "red", vjust = -0.5) +
  labs(title = "Farm Intensity Metrics",
       y = "Value",
       x = "") +
  theme_minimal()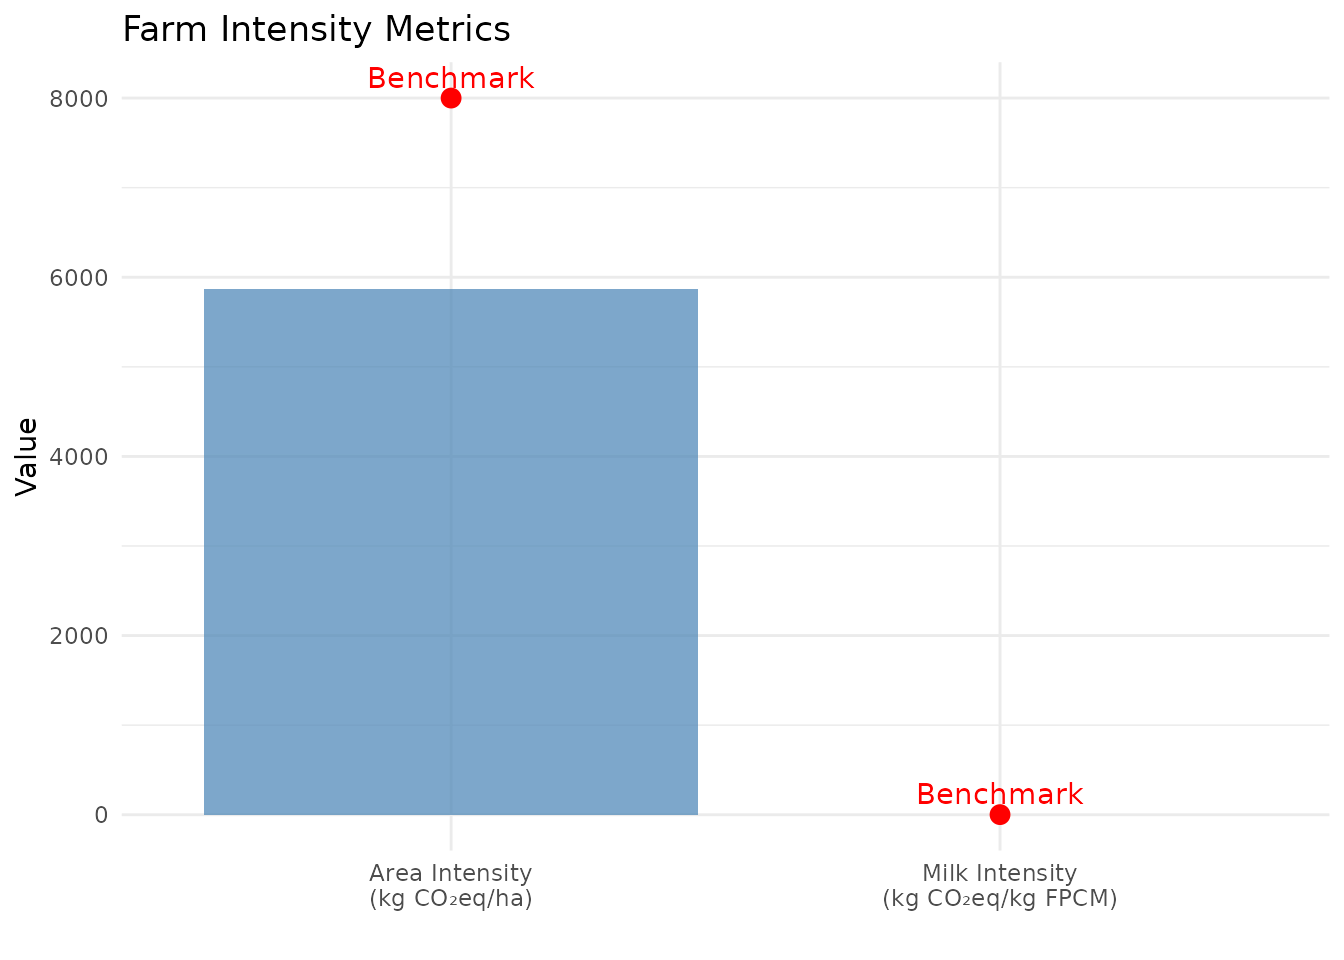
Understanding the Results
Data Quality Considerations
Required vs Optional Data
Essential data: - Herd size and composition - Milk production - Farm area - Major input quantities
Optional but recommended: - Detailed feed composition - Animal weights and productivity - Energy breakdown by use - Soil and climate characteristics
Common Issues
- Missing data: The package provides reasonable defaults, but farm-specific data improves accuracy
- Unit consistency: Ensure all inputs use the correct units (kg, litres, hectares)
- System boundaries: Be consistent about what’s included/excluded
- Temporal boundaries: Use annual data for meaningful comparisons
Next Steps
This introduction covered the basics of using cowfootR for single farm assessments. For more advanced topics, see:
- Single Farm Analysis: Detailed exploration of individual calculation functions
- Batch Farm Assessment: Processing multiple farms simultaneously
- Methodology Comparison: Understanding Tier 1 vs Tier 2 approaches
- Regional Factors: Using location-specific emission factors
Key Takeaways
- cowfootR follows internationally recognized LCA standards (IDF 2022, IPCC 2019)
- The modular approach allows flexible assessment of different emission sources
- Results should be interpreted in context of farm system and regional benchmarks
- Data quality significantly affects accuracy - collect farm-specific data when possible
- The package provides both absolute emissions and intensity metrics for comprehensive analysis
For questions, bug reports, or contributions, visit the cowfootR GitHub repository or contact the development team.